Advanced local currency bond markets support economic activity and also play a significant role in containing the effects of adverse shocks on the economy, helping it to absorb foreign capital inflows and enabling an effective debt management in public and private sectors. In other words, advanced and efficient bond markets facilitate the Treasury’s and companies’ debt management and support macroeconomic and financial stability.
A broad range of instruments and a broad investor base, an adequate level of liquidity of instruments at certain maturities, and the effective functioning of interbank money and swap markets that facilitate risk and liquidity management are among the development indicators for local currency bond markets.
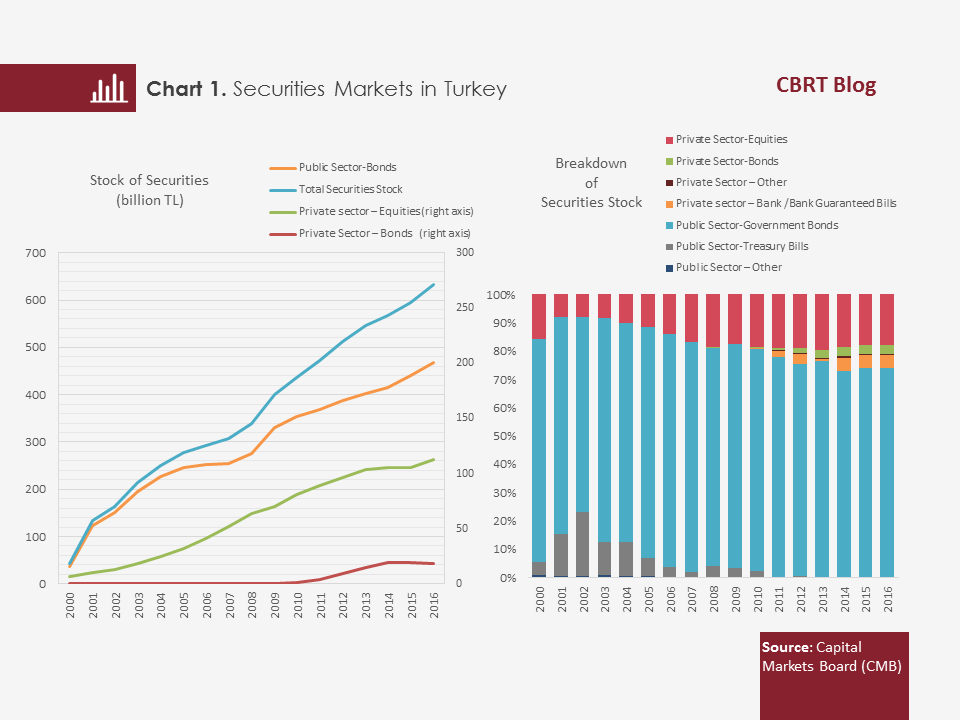
In Turkey, the local currency bond market has steadily grown over the years, the share of bonds issued by the private sector has increased in the total bond stock, and the government domestic debt securities (GDDS) have the highest share in the stock (Chart). Besides the size of their share in capital markets, the GDDSs are categorized as low-risk assets in domestic markets. Therefore, the most common benchmarks used in the pricing of other Turkish lira debt instruments are obtained from GDDS market data. In this context, Turkish lira yield curves are formed based on GDDS yields, and the presence of an effectively functioning secondary GDDS market with high liquidity is important for setting the benchmark yield rates across different maturities in a healthy manner.

In this blog post, we analyze the year-by-year change in liquidity formation at different maturities, which is one of the GDDS market development indicators, and discuss whether the conditions required for a healthy yield curve have materialized.
What Is a Yield Curve?
A yield curve basically shows the costs of a debt instrument across different maturities. For instance, if a discounted bond is traded on the GDDS market at all maturities from the overnight maturity to the longest maturity issued by the Treasury, then the curve formed by the yields of these transactions produces the government bond yield curve. However, when there is no government bond / bill traded at all maturities, the yield curve is formed based on data for bonds traded on the secondary market and this estimated curve is also used to figure out the yields at non-traded maturities[1].
What Is the Importance of the Yield Curve?
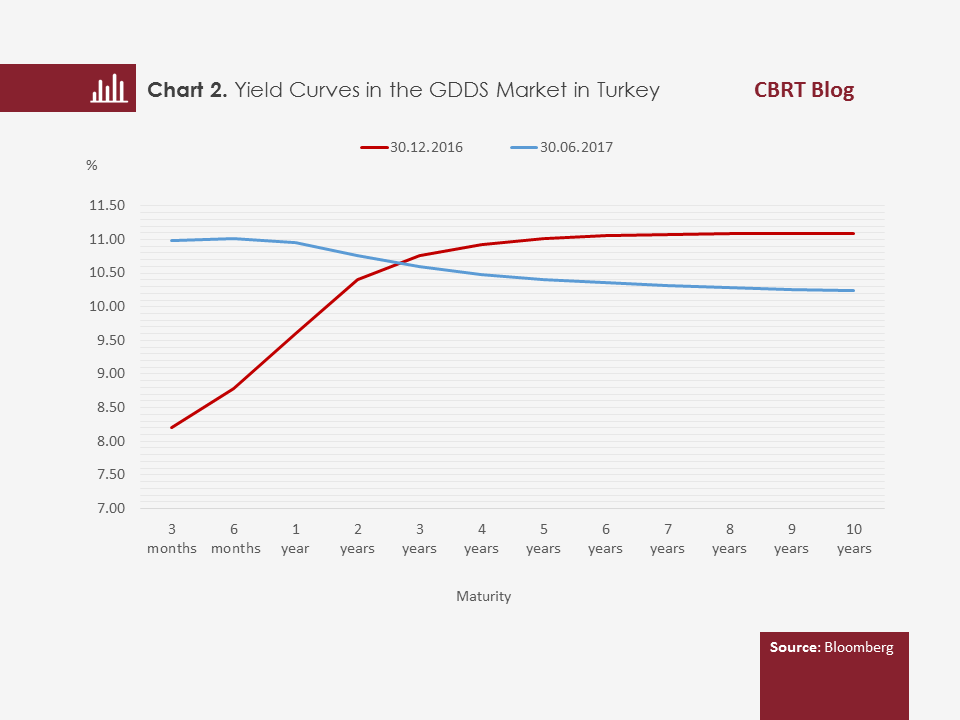
In addition to serving as a benchmark in market pricing, yield curves are also important for monetary policymakers. Central banks make use of yield curves to monitor the transmission channel between short-term interest rates employed as a policy instrument and long-term interest rates determined by the expectations and risk perceptions of market participants. Moreover, changes in the slope of the yield curve give hints about the expectations regarding variables such as the monetary policy stance, inflation and growth. For example, a negative yield curve, i.e. when short-term interest rates exceed long-term interest rates, usually points to a tight monetary policy stance (Chart 2).

Do Transaction Volumes Emerging Across Different Maturities in the GDDS Market over the Years Support the Formation of a Healthy Yield Curve?
The presence of securities at different maturities with high levels of market liquidity is the prerequisite for an estimation of the yield curve. The average maturity of domestic borrowing, which was nine months in the early 2000s, has been regularly extended through long-term auctions held in the framework of the Treasury’s strategy since 2005. With the commencement of fixed-income bond issues with 10-year maturity in 2010, the yield curve forecast horizon was also increased to up to 10 years. In early 2012, fixed-income bonds with a maturity of 5 and 10 years started being issued on a regular basis, which caused benchmark bonds to appear at these maturities in addition to the bonds with 2-year maturity.

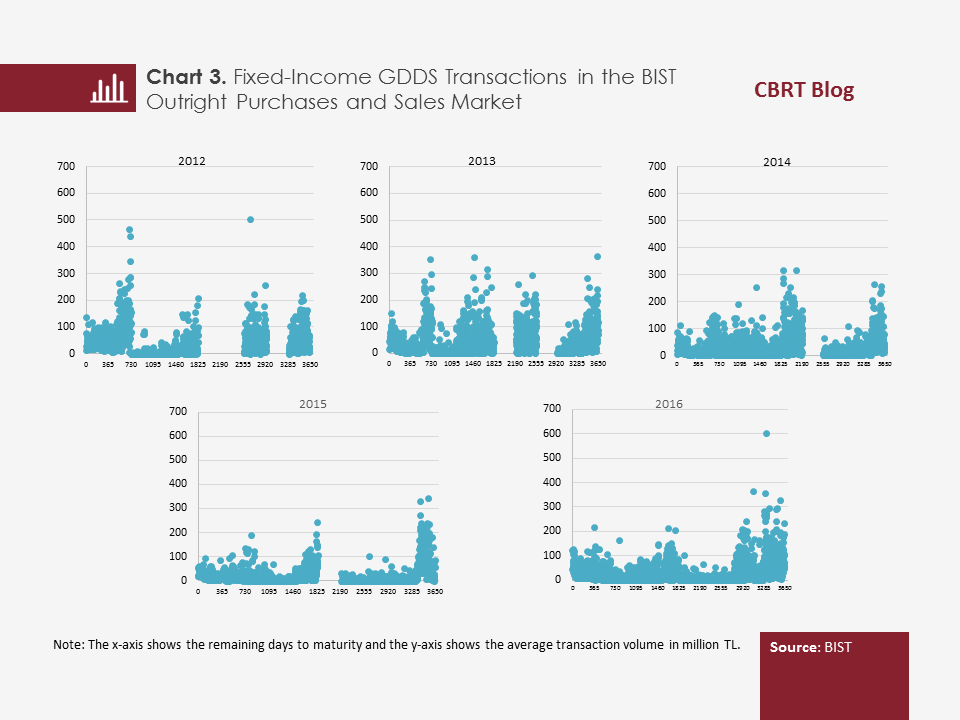
In the yield curve, following the issues of new bonds, the number of GDDSs gradually increases in time and the maturities of previously issued bonds shift to shorter terms. As the medium-term maturities are filled by the shifting maturities of previously issued bonds and as there is sufficient transaction volume, the explanatory power of forecast models has improved. Chart 3 presents the average volumes of fixed-income bond transactions in the Borsa Istanbul (BIST) secondary bond market between 2012 and 2016, based on remaining days to maturity. Accordingly, we see that the Treasury’s borrowing strategy has produced positive results in terms of dispersing the liquidity across maturities in the secondary market. To conclude, we assess that the growing transaction demand, the new bond issuances over the years and the maturity axis filled by the shifting maturities of previously issued bonds provide the adequate conditions necessary to form a healthy yield curve.
[1] Fixed-income assets are used in the calculations of the yield curve. As cash flows for variable coupon securities cannot be identified in advance, these securities are excluded from the analysis.
